9.4.3D Using Probabilities
Apply probability concepts to real-world situations to make informed decisions.
For example: Explain why a hockey coach might decide near the end of the game to pull the goalie to add another forward position player if the team is behind.
Another example: Consider the role that probabilities play in health care decisions, such as deciding between having eye surgery and wearing glasses.
Use the relationship between conditional probabilities and relative frequencies in contingency tables.
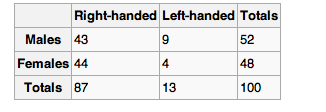
For example: A table that displays percentages relating gender (male or female) and handedness (right-handed or left-handed) can be used to determine the conditional probability of being left-handed, given that the gender is male.
Overview
Standard 9.4.3 Essential Understandings
Life is a school of probability. - Walter Bagehot
Students have calculated probabilities to solve real world problems in the form of experimental probabilities, probability as a fraction of sample space or area, and used random number generators to conduct simulations. This standard builds on this knowledge in that students learn counting strategies and more advanced probability concepts such as intersections, unions, complements, and conditional probability. Students work on "formalizing probability procedures and language, creating and interpreting probability distributions to solve real world problems, implementing simulation techniques, and presenting cohesive arguments in oral and written form." (Minnesota Math Frameworks, 1997, Randomness and Uncertainty, P. 19.) Students investigate probability problems with technology through simulations. Virtually all jobs require decision-making capabilities under uncertain conditions. Technology enables large amounts of data to be analyzed, but it is humans who must make sense of the data.
All Standard Benchmarks
9.4.3.1 Select and apply counting procedures, such as the multiplication and addition principles and tree diagrams, to determine the size of a sample space (the number of possible outcomes) and to calculate probabilities.
For example: If one girl and one boy are picked at random from a class with 20 girls and 15 boys, there are 20 × 15 = 300 different possibilities, so the probability that a particular girl is chosen together with a particular boy is 1/300.
9.4.3.2 Calculate experimental probabilities by performing simulations or experiments involving a probability model and using relative frequencies of outcomes.
9.4.3.3 Understand that the Law of Large Numbers expresses a relationship between the probabilities in a probability model and the experimental probabilities found by performing simulations or experiments involving the model.
9.4.3.4 Use random numbers generated by a calculator or a spreadsheet, or taken from a table, to perform probability simulations and to introduce fairness into decision making.
For example: If a group of students needs to fairly select one of its members to lead a discussion, they can use a random number to determine the selection.
9.4.3.5 Apply probability concepts such as intersections, unions and complements of events, and conditional probability and independence, to calculate probabilities and solve problems.
For example: The probability of tossing at least one head when flipping a fair coin three times can be calculated by looking at the complement of this event (flipping three tails in a row).
9.4.3.6 Describe the concepts of intersections, unions and complements using Venn diagrams. Understand the relationships between these concepts and the words AND, OR, NOT, as used in computerized searches and spreadsheets.
9.4.3.7 Understand and use simple probability formulas involving intersections, unions and complements of events.
For example: If the probability of an event is p, then the probability of the complement of an event is 1 - p; the probability of the intersection of two independent events is the product of their probabilities. Another example: The probability of the union of two events equals the sum of the probabilities of the two individual events minus the probability of the intersection of the events.
9.4.3.8 Apply probability concepts to real-world situations to make informed decisions.
For example: Explain why a hockey coach might decide near the end of the game to pull the goalie to add another forward position player if the team is behind. Another example: Consider the role that probabilities play in health care decisions, such as deciding between having eye surgery and wearing glasses.
9.4.3.9 Use the relationship between conditional probabilities and relative frequencies in contingency tables.
For example: A table that displays percentages relating gender (male or female) and handedness (right-handed or left-handed) can be used to determine the conditional probability of being left-handed, given that the gender is male.
Benchmark Group D
9.4.3.8 Apply probability concepts to real-world situations to make informed decisions. For example: Explain why a hockey coach might decide near the end of the game to pull the goalie to add another forward position player if the team is behind. Another example: Consider the role that probabilities play in health care decisions, such as deciding between having eye surgery and wearing glasses.
9.4.3.9 Use the relationship between conditional probabilities and relative frequencies in contingency tables. For example: A table that displays percentages relating gender (male or female) and handedness (right-handed or left-handed) can be used to determine the conditional probability of being left-handed, given that the gender is male.
What students should know and be able to do [at a mastery level] related to these benchmarks
- Students should be able to use multiple representations to solve probability problems.
- Students should use their knowledge of probability to assist them in everyday decision making that involves uncertainty
- Students should understand how to read and interpret contingency tables.
Work from previous grades that supports this new learning includes:
- Students have had experiences modeling different real world probabilistic situations.
- Students should be familiar with using the 0-1 scale as a measure of probability.
- Students have begun to develop counting techniques and have developed intuition about probability.
- Students have made and interpreted contingency tables, although probably not called "contingency tables", many times in previous work.
NCTM Standards
Data Analysis and Probability Standards
3. develop and evaluate inferences and predictions that are based on data
- understand how sample statistics reflect the values of population parameters and use sampling distributions as the basis for informal inference
4. understand and apply basic concepts of probability
- understand the concepts of sample space and probability distribution and construct sample spaces and distributions in simple cases
- use simulations to construct empirical probability distributions
- compute and interpret the expected value of random variables in simple cases
- understand the concepts of conditional probability and independent events
- understand how to compute the probability of a compound event.
Common Core State Standards (CCSS)
S-IC: Making Inferences and Justifying Conclusions
Understand and evaluate random processes underlying statistical experiments
2. Decide if a specified model is consistent with results from a given data-generating process, e.g., using simulation. For example, a model says a spinning coin falls heads up with probability 0.5. Would a result of 5 tails in a row cause you to question the model?
S-CP: Conditional Probability and the rules of Probability
Understand independence and conditional probability and use them to interpret data
1. Describe events as subsets of a sample space (the set of outcomes) using characteristics (or categories) of the outcomes, or as unions, intersections, or complements of other events ("or," "and," "not").
2. Understand that two events A and B are independent if the probability of A and B occurring together is the product of their probabilities, and use this characterization to determine if they are independent.
3. Understand the conditional probability of A given B as P(A and B)/P(B), and interpret independence of A and B as saying that the conditional probability of A given B is the same as the probability of A, and the conditional probability of B given A is the same as the probability of B.
4. Construct and interpret two-way frequency tables of data when two categories are associated with each object being classified. Use the two-way table as a sample space to decide if events are independent and to approximate conditional probabilities. For example, collect data from a random sample of students in your school on their favorite subject among math, science, and English. Estimate the probability that a randomly selected student from your school will favor science given that the student is in tenth grade. Do the same for other subjects and compare the results.
5. Recognize and explain the concepts of conditional probability and independence in everyday language and everyday situations. For example, compare the chance of having lung cancer if you are a smoker with the chance of being a smoker if you have lung cancer.
Use the rules of probability to compute probabilities of compound events in a uniform probability model
6. Find the conditional probability of A given B as the fraction of B's outcomes that also belong to A, and interpret the answer in terms of the model.
7. Apply the Addition Rule, P(A or B) = P(A) + P(B) - P(A and B), and interpret the answer in terms of the model.
8. (+) Apply the general Multiplication Rule in a uniform probability model, P(A and B) = P(A)P(B|A) = P(B)P(A|B), and interpret the answer in terms of the model.
9. (+) Use permutations and combinations to compute probabilities of compound events and solve problems.
S-MD: Using Probability to make decisions
Calculate expected values and use them to solve problems
1. (+) Define a random variable for a quantity of interest by assigning a numerical value to each event in a sample space; graph the corresponding probability distribution using the same graphical displays as for data distributions.
2. (+) Calculate the expected value of a random variable; interpret it as the mean of the probability distribution.
3. (+) Develop a probability distribution for a random variable defined for a sample space in which theoretical probabilities can be calculated; find the expected value. For example, find the theoretical probability distribution for the number of correct answers obtained by guessing on all five questions of a multiple-choice test where each question has four choices, and find the expected grade under various grading schemes.
4. (+) Develop a probability distribution for a random variable defined for a sample space in which probabilities are assigned empirically; find the expected value. For example, find a current data distribution on the number of TV sets per household in the United States, and calculate the expected number of sets per household. How many TV sets would you expect to find in 100 randomly selected households?
Use probability to evaluate outcomes of decisions
5. (+) Weigh the possible outcomes of a decision by assigning probabilities to payoff values and finding expected values.
a. Find the expected payoff for a game of chance. For example, find the expected winnings from a state lottery ticket or a game at a fast- food restaurant.
b. Evaluate and compare strategies on the basis of expected values. For example, compare a high-deductible versus a low-deductible automobile insurance policy using various, but reasonable, chances of having a minor or a major accident.
6. (+) Use probabilities to make fair decisions (e.g., drawing by lots, using a random number generator).
7. (+) Analyze decisions and strategies using probability concepts (e.g., product testing, medical testing, pulling a hockey goalie at the end of a game).
S-ID: Interpreting Categorical and Quantitative data
Summarize, represent, and interpret data on two categorical and quantitative variables
5. Summarize categorical data for two categories in two-way frequency tables. Interpret relative frequencies in the context of the data (including joint, marginal, and conditional relative frequencies). Recognize possible associations and trends in the data.
Misconceptions
Student Misconceptions and Common Errors
- "Research has shown that intuitions about probability are often incorrect, can lead us to incorrect conclusions about chance events, and persist despite age and education. Many of us have heard someone who has had a lengthy run of poor card hands dealt to them say they are certain they will get a good hand soon-they are "due." Ignoring the independence of each uncertain deal of the cards is called "gambler's fallacy" (Minnesota Math Frameworks, 1997, Randomness and Uncertainty, P.4)
- "Students need to be given experiences where they make predictions or estimate probabilities, then discover whether or not their intuitions or reasoning were correct. Students should be encouraged to distinguish between decisions and outcomes and between short runs and long runs. Students need help to confront and recognize their misconceptions about probability and statistics." (Minnesota Math Frameworks, 1997, Randomness and Uncertainty, P. 4 and 5.)
- Students sometimes confuse the meaning of the percentages that appear in contingencies tables.
Vignette
In the Classroom
The purpose of this lesson is to have the students explore data from a study and interpret the results using probability models.
According to the National Highway Traffic Safety Administration (NHTSA) in their report, Occupant Restraint Use in 2008- Results From the National Occupant Protection Use Survey Controlled Intersection Study, the use of child restraint in motor vehicles varies based on the age of the child as well as the use of seat belts and the gender of the driver. In the table below the first row separates out drivers by whether they wear seat belts and whether the driver is male or female. The second, third, and fourth rows are the passengers in the cars and give the percentages that they are wearing seat belts based on the characteristics of the drivers.
Child Restraint use in Passenger Motor Vehicles, by age and other characteristics
|
|
Belted Driver |
Unbelted Driver |
Male Driver |
Female Driver |
|
Infants (birth to 12 months) |
98% |
98% |
97% |
99% |
|
Children (1-3 years old) |
95% |
73% |
93% |
93% |
|
Children (4-7 years old) |
87% |
39% |
79% |
81% |
(The teacher can instruct the students to study the tables and make a statement about what they observe.)
Student: It looks like female drivers do a better job of restraining their children.
Student: Not always, men are the same for children 1-3 years old.
Teacher: That is correct, what else do you notice?
Student: It looks like everybody does a good job with babies, but not so good with older children.
Teacher: Why do you think that drivers do better with babies and not the older children?
Student: Maybe because you always hear about baby seats and how they need to be used and you do not hear much about older children.
Teacher: If I told you that there was a crash that involved an unbelted driver and a 6 year old child, would you guess that the child was restrained?
Student: I would say that the child was probably not restrained as only 39% of children in this category are restrained. That means that 61% are not.
Teacher: Additional data, from the study, indicates that 84% of all drivers wear seat belts. With this additional information, what is the percentage of all children aged 1-3 that are restrained?
Student: The total would be the combination of the restrained children in cars with belted drivers plus the restrained children from cars with unbelted drivers, right?
Student: That's easy, the percentage from belted drivers is 95% and belted drivers make up 84% of all drivers so the percentage is 95% times 84% or 79.8%.
Student: The percentage from unbelted drivers would be 73% of the children, but how many unbelted drivers are there?
Student: Well is 84% of drivers are belted, then 16% are not because a driver is either belted or not belted.
Student: So 73% of 16% is 11.68%. Now what?
Student: A child is in one of the two groups so we can add them together. 79.8% plus 11.68% is 91.48%
Student: So 91.48% of all children ages 1-3 are restrained.
Teacher: Talk in your groups and see if you can figure out the next couple of questions. Then I want you to look on the Internet for other statistics about driving. It could involve seatbelts or something else like texting, cell phones, drinking and driving, or other topics you might want to investigate. Be prepared to give a short summary of the data with examples of intersections, unions, and complements.
Resources
Teacher Notes
- The term "contingency table" is often not used in math texts. They are called: two-way tables, cross tabulation (cross tabs), or simply tables.
Lesson was adapted from "Activities: Explorations with Chance," Mathematics Teacher (April, 1992). In this lesson, students analyze the fairness of certain games by examining the probabilities of the outcomes. The explorations provide opportunities to predict results, play the games, and calculate probabilities. Students should have had prior experiences with simple probability investigations, including flipping coins, drawing items from a set, and making tree diagrams. They should understand that the probability of an event is the ratio of the number of successful outcomes to the number of possible outcomes.
Stick or Switch? Lesson was adapted from an article by J.M. Shaughnessy & T. Dick, Mathematics Teacher (April 1991). This lesson plan presents a classic game-show scenario. A student picks one of three doors in the hopes of winning the prize. The host, who knows the door behind which the prize is hidden, opens one of the two remaining doors. When no prize is revealed, the host asks if the student wishes to "stick or switch." Which choice gives you the best chance to win? The approach in this activity runs from guesses to experiments to computer simulations to theoretical models.
Web Links for Data Analysis and Probability
Additional Instructional Resources
- Journal of Statistics Education This international journal is on the teaching and learning of statistics.
- The Exploring Data-Math Forum This site provides standards, data sets, lessons and websites at the K-4, 5-8, and 9-12 levels.
- The Texas Instruments Classroom Activities Exchange The site can be used to supplement lessons on the concepts in Gr. 9-12 Data Analysis and Probability.
conditional probability the probability of an event given some other event.
contingency table: Displays the frequency distribution of two or more categorical variables in a matrix format
independent events Two events A and B are independent if the chance that they both happen simultaneously is the product of the chances that each occurs individually; i.e., if P(A and B) = P(A)P(B). This is essentially equivalent to saying that learning that one event occurs does not give any information about whether the other event occurred too.
mutually exclusive events that have no common outcomes (the intersection of two events is empty).
probability model. A probability model is used to assign probabilities to
outcomes of a chance process by examining the nature of the process. The set
of all outcomes is called the sample space, and their probabilities sum to 1.
Reflection - Critical Questions regarding the teaching and learning of these benchmarks:
- How can you better plan your lessons in the future so students have experiences with making predictions or estimating probabilities with relevant real world situations?
- How well structured were the activities for students to explain their reasoning or intuitions and then confront or recognize any misconceptions that they had?
- How well can students explain where they will need knowledge of probability in their lives?
- Were students able to explain or demonstrate their knowledge in different representations (language, real world situations, pictorial, symbols, and manipulatives)? How can you facilitate students' translations between representations for more conceptual knowledge?
Materials - suggested articles and books
American Statistical Association. (2007). Publications for assessment and instruction in statistics education.
Haberman, M. (1991). The pedagogy of poverty versus good teaching. Phi Delta Kapan, December, 291-294.
Peck, R., Starnes, D., Kranendank, H., & Morita, J. (2009). Making sense of statistical studies: Teacher's module. Alexandria, VA: American Statistical Association.This book consists of 15 hands-on investigations that provide students with valuable experience in designing and analyzing statistical studies. It is written for an upper middle-school or high-school audience. Each investigation includes a descriptive overview, prior knowledge that students need, learning objectives, teaching tips, references, possible extensions, and suggested answers.
This is the K-12 portion of the American Statistical Association (ASA) website. They have workshops and online resources for teachers, useful websites, student competitions, and a list of publications in statistics education.
Rosenstien, J., Caldwell, J., & Crown, W. (1996). New Jersey mathematics curriculum framework. Trenton, NJ: New Jersey State Department of Education.
SciMath Minnesota. (1997). Minnesota k-12 mathematics framework. St. Paul, MN: SciMath.
Yates, D. S., Starnes, D S., & Moore, D. S. (2005) Statistics through application. New York: W.H Freeman
Assessment
- (DOK Level 1: Recall) In the table below what is the conditional probability of being right-handed given that the gender is female?
- (DOK level 2: Basic Reasoning)
(MCA-II item sampler) http://education.state.mn.us/MDE/Accountability_Programs/Assessment_and…
Differentiation
- Strategies: Real world problem solving, multiple entry points, vary teaching methods, group work, teach problem solving strategies.
- Challenges: motivation, slower processing, reading and writing ability, organization, and behavior issues and coping strategies.
Teachers must be explicit in how they talk of vocabulary terms and use vocabulary in context. Teachers should use vocabulary terms often so that students will become familiar hearing them in context. Students should also be allowed to practice the use of vocabulary in small groups.
- Strategies: modeling vocabulary, using manipulatives, speaking slowly, using visuals, using a variety of assessments, assigning group work, verbalizing reasoning, understanding context or concept, making personal dictionaries.
- Challenges: Vocabulary and Reading ability, standardized tests, how to approach problem solving, and cultural differences.
Minnesota Council for the Gifted and Talented
- Strategies: Tiered objectives, open-ended problem solving, grouping (heterogeneous and homogeneous), curriculum compacting, and independent investigations.
- Challenges: Motivation, acceleration and attitude associated with this for students, maturity, isolation and social issues, and not wanting to be moved outside of age group.
Parents/Admin
Administrative/Peer Classroom Observation
|
Students are... |
Teachers are... |
|
conducting probability experiments. |
facilitating student learning by structuring activities for students to work in groups. |
|
creating hypotheses. |
leading discourse that allows students to communicate their ideas. |
|
investigating relevant real world problems. |
presenting engaging problems that allow student understanding to build on others' ideas. |
|
providing justification for their ideas. |
engaging students by using technology. |
|
refining their strategies and ideas. |
instructing to allow students to develop ideas and construct their knowledge. |
|
thinking critically about events and probabilities. |
|
"The best way to approach this content is with open-ended investigations that allow the students to arrive at their own conclusions through experimentation and discussion." (New Jersey Mathematics Curriculum Framework, 1996, p. 371)
Parent Resources
- Lohr, Steve. (2009). For Today's Graduate, Just one word: Statistics. New York Times. This is an article about the growing variety of jobs in statistics that are available due to the advancements in technology.
- National Library of Virtual Manipulatives. This website has a variety of applets and activities for students to explore patterns and investigate probability.
- High School Statistics Resources for Teachers, Parents, and Students.This website has summary information of other websites that can be helpful for further information, practice, and exploration for students.
- Search You Tube for instructional videos on probability and statistics
- List of websites that have probability activities that are in line with the Massachusetts Curriculum Framework Document.
- This website has collections of articles regarding statistics and probability. It contains numerous current events that relate to statistics.