6.4.1B Probability & Experiments
Determine the probability of an event using the ratio between the size of the event and the size of the sample space; represent probabilities as percents, fractions and decimals between 0 and 1 inclusive. Understand that probabilities measure likelihood.
For example: Each outcome for a balanced number cube has probability $\frac{1}{6}$, and the probability of rolling an even number is $\frac{1}{2}$.
Perform experiments for situations in which the probabilities are known, compare the resulting relative frequencies with the known probabilities; know that there may be differences.
For example: Heads and tails are equally likely when flipping a fair coin, but if several different students flipped fair coins 10 times, it is likely that they will find a variety of relative frequencies of heads and tails.
Calculate experimental probabilities from experiments; represent them as percents, fractions and decimals between 0 and 1 inclusive. Use experimental probabilities to make predictions when actual probabilities are unknown.
For example: Repeatedly draw colored chips with replacement from a bag with an unknown mixture of chips, record relative frequencies, and use the results to make predictions about the contents of the bag.
Overview
Students begin with an intuitive sense of probability. The formal understanding of probability starts with determining the set of all possible outcomes of an experiment, or sample space. Describing this sample space in a visual representation (tree diagram, table, or picture) guides student thinking towards the relationship between an event and the entire sample space. The ratio between the size of the event and the size of the sample space becomes the foundation of probability at this level. Students use fractions, decimals, and percents to describe probability as a measure of certainty ranging from 0 to 1 inclusive. Students conduct experiments for events where the probability is known, to compare the experimental results (relative frequency) with expected probabilities. Other experiments are conducted in situations where no probabilities are known. The resulting experimental probabilities are then used to make predictions of what will occur in future experiments.
All Standard Benchmarks
6.4.1.1 Determine the sample space (set of possible outcomes) for a given experiment and determine which members of the sample space are related to certain events. Sample space may be determined by the use of tree diagrams, tables or pictorial representations.
6.4.1.2 Determine the probability of an event using the ratio between the size of the event and the size of the sample space; represent probabilities as percents, fractions and decimals between 0 and 1 inclusive. Understand that probabilities measure likelihood.
6.4.1.3 Perform experiments for situations in which the probabilities are known, compare the resulting relative frequencies with the known probabilities; know that there may be differences.
6.4.1.4 Calculate experimental probabilities from experiments; represent them as percents, fractions and decimals between 0 and 1 inclusive. Use experimental probabilities to make predictions when actual probabilities are unknown.
Benchmark Group B
6.4.1.2 Determine the probability of an event using the ratio between the size of the event and the size of the sample space; represent probabilities as percents, fractions and decimals between 0 and 1 inclusive. Understand that probabilities measure likelihood.
6.4.1.3 Perform experiments for situations in which the probabilities are known, compare the resulting relative frequencies with the known probabilities; know that there may be differences.
6.4.1.4 Calculate experimental probabilities from experiments; represent them as percents, fractions and decimals between 0 and 1 inclusive. Use experimental probabilities to make predictions when actual probabilities are unknown.
What students should know and be able to do [at a mastery level] related to these benchmarks
- Perform experiments and collect data;
- Determine probabilities;
- Express probabilities as fractions, decimals, and percents;
- Use probabilities to make predictions;
- Use words such as impossible, unlikely, equally likely, likely, or certain to describe the likelihood of an event occurring;
- Compare relative frequencies (experimental results) to known probabilities and know that there may be differences;
- Understand that relative frequencies (experimental probabilities) don't always fit with probabilities based on mathematical models;
- Understand that relative frequencies (experimental probabilities) come closer to probabilities based on mathematical models as the number of trials increase.
Work from previous grades that supports this new learning includes:
- Use tables, bar graphs, and Venn diagrams to display data sets. The data may include fractions or decimals. Understand that spreadsheet tables and graphs can be used to display data;
- Collect, display and interpret data using tables;
- Recognize and generate equivalent decimals and fractions;
- Order fractions and decimals;
- Understand that percent represents parts of 100 and ratios to 100;
- Identify and use ratios to compare quantities; understand that comparing quantities using ratios is not the same as comparing quantities using subtraction;
- Determine equivalences among fractions, decimals and percents; select among these representations to solve problems;
- Measure angles in geometric figures and real-world objects with a protractor or angle ruler (relevant for spinners);
- Compare angles according to size (relevant for spinners);
- Understand that a variable can be used to represent a quantity that can change, often in relationship to another changing quantity. Use variables in various contexts.
NCTM Standards
- Understand and apply basic concepts of probability
○ Use proportionality and a basic understanding of probability to make and test conjectures about the results of experiments and simulations;
○ Compute probabilities for simple compound events, using such methods as organized lists, tree diagrams, and area models.
○ Recognize reasoning and proof as fundamental aspects of mathematics.
○ Make and investigate mathematical conjectures.
- Build new mathematical knowledge through problem solving.
- Create and use representations to organize, record, and communicate mathematical ideas.
- Use the language of mathematics to express mathematical ideas precisely.
- Recognize and apply mathematics in contexts outside of mathematics.
Common Core State Standards (CCSS)
7SP (Statistics and Probability) Investigate chance processes and develop, use, and evaluate probability models.
7.SP.5 Understand that the probability of a chance event is a number between 0 and 1 that expresses the likelihood of the event occurring. Larger numbers indicate greater likelihood. A probability near 0 indicates an unlikely event, a probability around 1/2 indicates an event that is neither unlikely nor likely, and a probability near 1 indicates a likely event.
7.SP.6 Approximate the probability of a chance event by collecting data on the chance process that produces it and observing its long-run relative frequency, and predict the approximate relative frequency given the probability. For example, when rolling a number cube 600 times, predict that a 3 or 6 would be rolled roughly 200 times, but probably not exactly 200 times.
7.SP.7 Develop a probability model and use it to find probabilities of events. Compare probabilities from a model to observed frequencies; if the agreement is not good, explain possible sources of the discrepancy.
7.SP.8 Find probabilities of compound events using organized lists, tables, tree diagrams, and simulation.
- 7.SP.8b. Represent sample spaces for compound events using methods such as organized lists, tables and tree diagrams. For an event described in everyday language (e.g., "rolling double sixes"), identify the outcomes in the sample space which compose the event.
Misconceptions
Student Misconceptions and Common Errors
- Students believe that to be "fair," everything should have an equal chance of happening in a sampling experiment;
- Students predict likelihood based on absolute rather than relative size;
- Students create "part to part" rather than "part to whole" relationships to determine probability;
- Students predict the outcome of the next trial in an experiment rather than what is likely to occur;
- Intuition and hunches, often misleading, are used to predict likelihood.
- Students believe that all outcomes have the same chance of happening;
Vignette
In the Classroom
The following vignette shows students performing an experiment that involves rolling two dice to determine relative frequencies.
Ms. Dronen: How many of you play games that use dice?
Student: I play Monopoly all the time with my brother.
Student: I like Yahtzee better.
Student: Does Farkle count?
Student: I used to play Candyland when I was little.
Ms. Dronen: It sounds like many of you are quite familiar with games involving dice. Many board games, like Monopoly, require that you add the numbers from two dice and use that sum to tell you how many spaces to advance. Have you ever thought about which sums are more likely to occur? For example, are you more likely to get a sum of 2 or 7 when rolling two dice?
Student: I don't know. I've never thought about it, but maybe 7 because the only way to get 2 is to roll snake eyes.
Ms. Dronen: Snake eyes?
Student: Yes, two 1s.
Ms. Dronen: Well, let's do some investigation. I'm going to give each of you two dice. I want you to roll your dice twenty times, add up what you get, and record the sum for each of the twenty trials in your notebook. Any questions? All right. As soon as you get your dice, you can get started.
(Students roll dice and record their data.)
Sample student work:
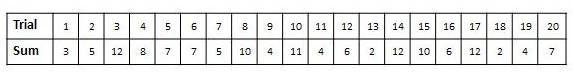
Ms. Dronen: Now we're going to use the data you've collected to determine the relative frequencies.
Student: What do you mean by relative frequencies? I've heard those words before, but don't remember what they mean.
Ms. Dronen: Let's take that phrase apart and consider each word individually. Where have you heard the word relative before?
Student: We celebrate holidays with relatives. Relatives are like my cousins and grandparents.
Ms. Dronen: Yes, relatives are someone with whom you have a special relationship. And where have you heard the word frequency or frequent?
Student: "Frequent Fliers" are people who do a lot of traveling.
Ms. Dronen: Yes, the words "frequent fliers" are sometimes used to describe people who travel often. So if relative has something to do with special relationships and frequency has something to do with how often, how are the words relative frequencies connected to our investigation with dice?
Student: I think relative frequencies have something to do with how often certain numbers show up when you add up the dice.
Ms. Dronen: Yes, frequency has to do with how often, but what about the relative part?
Student: Oh, I remember. Relative frequency is the ratio relationship between how many times a particular outcome occurs in an experiment and the total number of trials.
Ms. Dronen: Please give an example to help us understand what you mean.
Student: O.K. If I roll the dice ten times and get a sum of 5, three of the ten times, then the relative frequency is 3/10 or 30%.
Ms. Dronen: Exactly! Relative frequencies are sometimes called experimental probabilities, because the probabilities are based on experimental results. All probabilities can be expressed as fractions, decimals, or percents. Please go ahead and get started on finding your relative frequencies now.
Student: Wait. I'm confused. If relative frequency is the ratio of how many times a particular outcome has occurred to how many trials have occurred, then won't each of us have a fraction with denominator 20?
Ms. Dronen: Why do you think that?
Student: Because everybody did 20 trials.
Ms. Dronen: Good observation, but remember that relative probabilities can be expressed as fractions, decimals, or percents. Besides, often times fractions can be simplified, which would change the denominator.
Student: Oh, that makes sense.
(Ms. Dronen circulates around the room assisting students determine relative frequencies.)
Ms. Dronen: Let's take some time now to discuss our results. I want to go back to my earlier question and ask whether you think you are more likely to get a sum of 2 or 7 when rolling two dice?
Student: I think 7, because I got a 7 five of the twenty times, but only got a 2 once.
Ms. Dronen: So what are their relative frequencies?
Student: I suppose it would be 5/20 for 7 and 1/20 for 2.
Ms. Dronen: What is another way you could express those relative frequencies?
Student: Well, 5/20 is the same as 1/4, or 25%. I'm not sure about the 1/20.
Student: I know. You can write 1/20 as 5/100 because it's an equivalent ratio, and that's the same as 0.05 or 5%.
Ms. Dronen: Excellent! Did anyone else get those same relative frequencies for 7 and 2?
Student: I had the same relative frequency of 5/20 for 7, but a relative frequency of 0/20 for 2 because I didn't roll any 2s.
Ms. Dronen: So you had the same relative frequency for 7 and a different relative frequency for 2; but you still had more 7s than 2s. Anyone else?
Student: I got totally different results. I had two 7s and three 2s.
Ms. Dronen: So you had more "2s" than "7s." Are there others in the class who had more "2s" than "7s?"
(Two students raise their hands.)
Ms. Dronen: Hmmm. It appears that most students got more 7s than 2s in our experiment, but not everybody. Anyone have thoughts on why that happened?
Student: You should get more 7s than 2s because there are lots of ways to get a sum of 7. You could roll a 1and 6, a 2 and 5, and 3 and 4, a 4 and 3, a 5 and 2, or a 6 and 1. That's six different ways. But there's only one way to get a sum of 2. You have to roll a 1 and 1.
Ms. Dronen: Oh, snake eyes. That makes sense. But why didn't everybody get more 7s than 2s?
Student: You're supposed to get more 7s than 2s according to a mathematical model, but outcomes cannot be predicted. The mathematical model may show that it is more likely to get a sum of 7, but there's no guarantee.
Ms. Dronen: Mathematical model? Hmmm. I think this is a great place to stop for today. We'll continue this discussion tomorrow and talk about a mathematical model for this experiment.
Resources
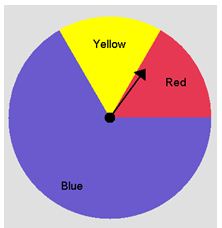
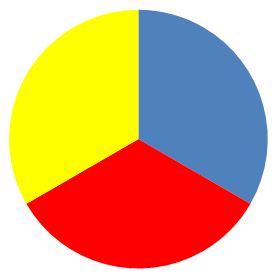
- The misconceptions that all outcomes have the same chance of happening and what it means to be fair can be addressed by having students perform experiments that will result in relative frequencies that confront their beliefs. As an example, using the spinner shown below in an experiment provides students with data that shows the three colors are not equally likely to happen. The spinner is "fair" because the experimental results should be in proportion to the area of each color. The spinner would be "unfair" if it was tipped to one side, affecting the randomness of the results.
- Understanding ratios as a relationship between two numbers is the cornerstone of probability. When asked which of the bags shown below gives the better chance of picking a red counter, many students will say Bag B. Furthermore, they may give as their reason "because there are more reds in Bag B."
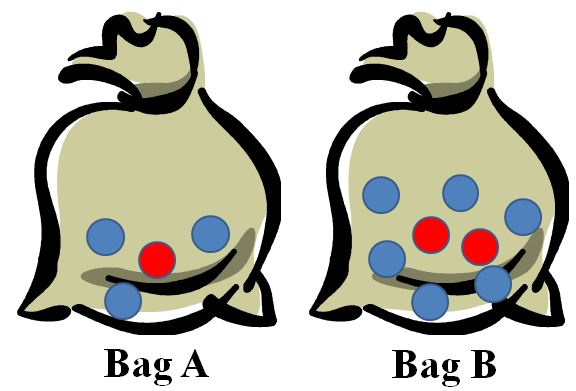
These misconceptions can be addressed by focusing on the relationship between the number of red and blue counters. It is the relative size of the outcome (both bags have the same ratio for number of red to number to blue) rather than the absolute size (number of red in Bag A is 1and Bag B is 2) that determines likelihood. Part-whole relationships are the key to the bag problem. Students possess intuition of part-whole relationships, and these relationships become essential building blocks for the ratio concept and understanding relative frequencies.
- Some students believe that their task is to correctly predict the outcome of a single trial of an experiment rather than what would occur if the experiment were repeated again and again. They may use intuition or hunches to make predictions and ignore mathematical models. For example, in a coin toss experiment where the last 5 tosses have resulted in tails, a student might predict heads as most likely result of the next trial believing they are "due." Asking students whether their prediction would be different given the experimental results of 1,000 trials may help them to recognize that their task is to predict likelihood of an outcome, not the result of a single trial.
- In order to challenge intuition and hunches, students need to get their hands on actual data and make their own conjectures about chance. They need to test their conjectures, find ways to represent the data they gathered, and communicate their findings to fellow students.
- These benchmarks include many new vocabulary words. It is important for students to have a strong conceptual understanding of probability as a ratio before introducing words such as "theoretical" and "experimental."
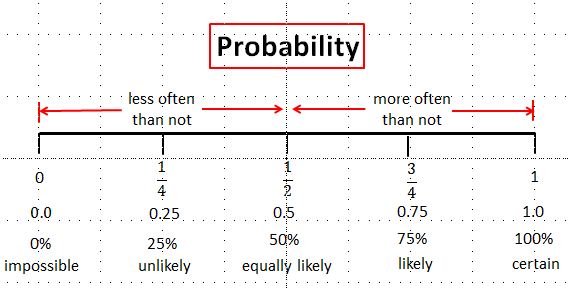
- Describing events in context as "certain," "likely", "equally likely" "unlikely," "impossible," and "random" will help students make meaning of the concept of an event.
NCTM Illuminations
- Sticks and Stones, a probability simulation based on a Native American game. Note that the second part of this activity involves "expected value," which is not a concept for this grade level.
- Boxing Up, a simulation using box models that explores the relationship between experimental and theoretical probability
- Adjustable Spinner, a simulation with an adjustable spinner that allows exploration of the relationship between experimental and theoretical probability
- Probability Explorations, five experiments organized in stations that explore experimental versus theoretical probability
- Two Points - Who Won the Basketball Game? a challenge where two coin tosses are used to simulate one shot, in order to achieve probability ¾ of making the shot.
- Misaddressed, a challenge where a chart or tree diagram could be used to determine probability identifying whether checks have been placed in the correct envelopes.
Additional Instructional Resources
- Exploring Probability - Explore It (Object Interactive), an interactive resource that allows students to explore outcomes resulting from tossing a coin, rolling a die, and using a spinner.
- Adjustable Spinner (Object Interactive), an applet that allows the user to adjust a spinner to explore experimental and theoretical probabilities
New Vocabulary
between 0 and 1 inclusive: all numbers from 0 to 1, including 0 and 1
certain event: an event that will occur; it has a probability of 1 or 100%
Example: Rolling a fair die and getting a 1, 2, 3, 4, 5, or 6 is a certain event. Its probability is 1 or 100%.
event: a set of one or more outcomes of a probability experiment. The outcomes are a subset of the sample space, to which a probability can be assigned.
Example: The probability of getting an even number when rolling a die is 1/3.
experiment (in probability) - situation that has more than one possible outcome (result), in which the outcomes can be specified in advance and depend on chance.
Example: A coin toss is an experiment because there is more than one possible outcome, the outcomes (heads and tails) can be specified in advance, and there is an element of chance. We cannot know the outcome until the coin is actually flipped.
experimental probability: probability based on the results of an experiment (relative frequencies). Determined by using the ratio of the number of times a particular outcome has occurred to the total number of trials .
Example: If you select 12 marbles out of a bag and 9 of them are green, the experimental probability of selecting green is $\frac{9}{12}$ or $\frac{3}{4}$
frequency: number of times an event occurs
Example: In four trials of a coin toss experiment with outcomes H, T, H, and H, the frequency of H is 3.
impossible event: an event that cannot occur. Its probability is 0 or 0%
Example: rolling a fair die and getting a 7 is impossible. Its probability is 0 or 0%.
known probability: situation in which the probability can be determined
Example: In a class with 10 boys and 20 girls, the known probability for choosing a boy a random is $\frac{1}{3}$.
likely event: an event with high probability
Example: In Minnesota, having a blizzard in January is a likely event.
outcome: the result of one trial of an experiment
Example: The outcome for one trial of an experiment that involves rolling a die and tossing a coin may be 6H.
percent: per hundred, or out of 100
Example: "12% of sixth grade students are left-handed" means that out every 100 sixth grade students, 12 are left-handed.
predict: tell what might happen ahead of time, make an educated guess about what might happen.
Example: When rolling a die, it can be predicted that the outcome will be an even number about 50% of the time.
probability: a number from 0 to 1 inclusive that indicates the likelihood of an event happening. If all outcomes in the sample space are equally likely (most often the case at this grade level), probability is determined by the ratio of the size of the event (number of possible outcomes in which the event occurs) to the size of the sample space (number of all possible outcomes). A common exception to the "equally likely" rule is a spinner, where there may be two or more outcomes that aren't equally likely.
Example: The probability of getting an even number when rolling a die is $\frac{3}{6}$. This probability can also be written as $\frac{1}{2}$, 0.5 or 50%.
random: not predictable
Example: The outcome of tossing a coin is random because it cannot be predicted. However, the likelihood of getting "heads" can be predicted.
ratio: comparison of two quantities by division. This relationship can be expressed as a fraction, decimal, or percent, as well as with a colon or in words. Fractions, decimals, and percents represent part-to-whole relationships, while expressing ratios with a colon or words may represent part-to-part relationships or part-to-whole relationships.
Example: If a team wins 3 games out of 5 games played, the ratio of wins to total games played can be written as $\frac{3}{5}$, 0.6, 60%, 3 to 5, 3:5 or "three to five."
relative frequency: ratio, based on experimental results, of the number of times a particular outcome has occurred to the total number of trials
Example: If you picked 12 marbles out of a bag and 9 of them were green, then the relative frequency would be $\frac{9}{12}$ or $\frac{3}{4}$.
sample space: set of elements that represents all possible outcomes of an experiment
Example: The sample space for tossing two coins is {HH, TT, HT, and TH}.
theoretical probability: probability that is expected based on a mathematical model that accurately reflects the ratio of the size of the event to the size of the sample space.
Example: When tossing a coin, the theoretical probability of getting "heads" is $\frac{1}{2}$.
unlikely event: an event with low probability
Example: In Minnesota, having an outdoor temperature above 60° F in January 15 is an unlikely event.
Reflection - Critical Questions regarding the teaching and learning of these benchmarks
- How were concepts and skills introduced through problem-solving or reasoning experiences?
- How did instruction and student tasks further develop students' understanding of probability?
- What strategies and accommodations were used so that all students experienced a common foundation?
- What is the evidence that students are making conjectures, explaining their ideas, and questioning solutions that do not make sense to them?
- How was technology used to foster a deeper understanding of probability?
Additional Materials
Details about these materials can be found in the References section.
Chapter 9, Probability, pp. 135-137.
(Click on "Uncertainty")
NCTM Principles and Standards for School Mathematics
Grades 6-8 Data Analysis and Probability, Understand and Apply, pp. 253-255.
NCTM A Research Companion to Principles and Standards for School Mathematics
Chapter 14, Research on Students' Understanding of Probability, pp. 216-224.
Keeley, P., & Rose, C. (2006). Mathematics curriculum topic study. Thousand Oaks, CA: Corwin Press.
Kilpatrick, J., Martin, W., & Schifter, D. (Eds.). (2003). A research companion to principles and standards for school mathematics. Reston, VA: National Council of Teachers of Mathematics, Inc.
Minnesota's K-12 Mathematics Frameworks. (1998). St. Paul, MN: SciMathMN.
National Council of Teachers of Mathematics. (2010). Developing essential understanding of ratios, proportions & proportional reasoning Grades 6-8. Reston, VA: National Council of Teachers of Mathematics, Inc.
National Council of Teachers of Mathematics. (2000). Principles and standards for school mathematics. Reston, VA: National Council of Teachers of Mathematics, Inc.
Project 2061 Atlas of Science Literacy Volume 1. (2001). USA: American Association for the Advancement of Science.
Project 2061, Atlas of Science Literacy Volume 2. (2007). USA: American Association for the Advancement of Science.
Assessment
(DOK 1)
1. Josh put 20 tiles, numbered 1 through 20, into a bag. If Josh reaches into the bag and takes out a tile without looking, what is the probability that he will take out a tile with a number greater than 15?
Answer: 1/4 or 0.25 or 25%
(DOK 1)
2. Suppose you perform an experiment 50 times and a friend performs the same experiment 500 times. Whose experimental probability would you expect to be closer to the theoretical probability? Justify your answer.
Sample Answer: I expect my friend's experimental probability to be closer to the theoretical probability. Experimental probabilities come closer to theoretical probabilities as the number of trials increase, and my friend performed many more trials than I did.
(DOK 2) (MCA Mathematics released test item 280177, Minnesota Department of Education)
3. Susan has a box that contains 4 yellow, 8 green, 10 orange, and 3 red markers. Susan randomly selects a marker from the box. What is the probability that she does not select a yellow or orange marker?
A. 0.11 B. 0.14 C. 0.44 D. 0.56
Answer: C
(DOK 2)
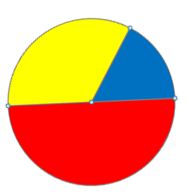
4. Draw a spinner where the probability of spinning blue is 1/6, and spinning red is 50%.
Sample answer:
(DOK 2)
5. In a survey, 20 students were asked their favorite breakfast food. The table below shows the results. Use the table to answer the following questions.
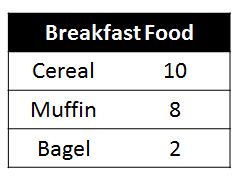
a. What is the probability that a student likes bagels?
Answer: 1/10 , 0.10 or 10%
b. About how many students out of 100 would you expect to like bagels?
Answer: 10 students
c. Predict how many students out of 500 would like muffins.
Answer: 200 students
(DOK Level 3)
6. A single trial of an experiment consists of flipping a coin three times. Suppose you perform the experiment 100 times. About how many times would you expect to get HHH or TTT? Show or explain your reasoning.
Sample answers: I would expect the results 25 times. The possible outcomes are {(HHH, HTH, HTT, HHT, TTT, THT, THH, TTH}.
The probability of HHH or TTT is 2/8 or 25%. 25% of 100 is 25 or
P(HHH) = 1/8 and P(TTT) = 1/8 ; 1/8 + 1/8 = 1/4 and 1/4 of 100 is 25.
(DOK Level 4)
7. Jorge, Greta, and Owen each performed 30 trials of an experiment using the spinner shown below. Jorge's relative frequency for spinning red was 1/3 Greta's relative frequency for spinning red was 2/5 . Owen's relative frequency for spinning red was 1/10.
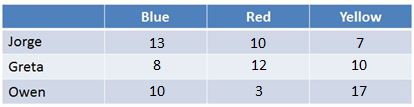
8. Complete the table below to show one possibility for the experimental results.
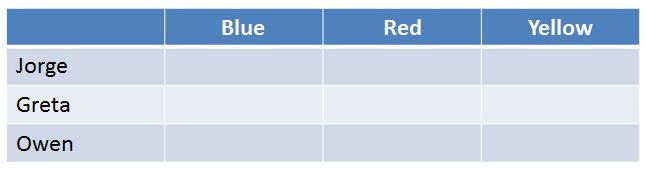
Sample Answer: Note: Only the "Red" results will be the same for each student. The sum of results for each row should always be 30.
Differentiation
- Students may need to review the concept of ratio as a part-to-part or part-to-whole relationship and various ways that ratio can be expressed;
- Emphasize that probability is a part-to-whole relationship, rather than part-to-part;
- Set up experiments so that students move from the concrete to abstract;
- Provide students with graphic organizers to record the results of their experiments;
- Calculators can be used to assist students in translating among fractions and decimals and percents;
- Provide resource sheets with summary information.
• A number line from 0 to 1, inclusive can be used to post quantitative and qualitative descriptions of probability.
Example:
• Create a visual glossary.
• Use graphic organizers to compare and contrast key words, such as theoretical and experimental probability.
• Make concept maps.
• Partner English learners with strong English speakers when performing experiments.
• Use think/pair/share to increase participation and involvement.
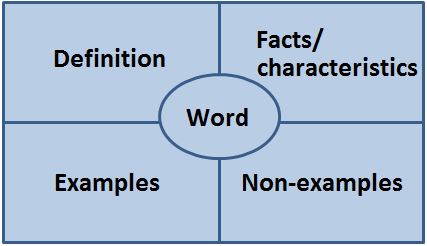
• Use graphic organizers such as the Frayer model shown below, for vocabulary development.
- Ask students to investigate how probability is used in real-life situations, such as weather forecasting and batting averages, to predict unknown events.
- Ask students to design their own experiments and use the results to make predictions;
- Give students experimental results and ask students to design the experiment.
Parents/Admin
Students are: (descriptive list) | Teachers are: (descriptive list) |
using key vocabulary words relating to probability. | supporting vocabulary development with strategies such as word walls, use in context, and visual glossaries. |
understanding probability as the ratio of the size of the event to the (number of possible outcomes in which the event occurs) to the size of the sample space (number of all possible outcomes). | building on student understanding of part-to-whole relationships and explicitly connecting ratio to probability. |
using visual representations, such as tree diagrams, charts, tables, and grids to record and organize data used in determining probability. | modeling use of various graphic organizers to represent the data used in determining probability. |
using manipulatives, such as dice, spinners, coins, and cards, to perform experiments and determine relative frequencies. | providing students with multiple opportunities to investigate chance situations. |
expressing probabilities as fractions, decimals, and percents. | modeling the flexible use of fractions, decimals, and percents as proportional representations of probability. |
generating their own questions about how probability is used in real life. | encouraging students to conduct investigations to answer their own questions. |
having shared experiences that allow class data to be pooled. | creating experiences to develop a common language and see the effect of increased trials. |
predicting the likelihood of events occurring. | asking students to make predictions or estimate probabilities, then discover whether their conjectures are correct. |
gathering actual data from probability experiments to challenge beliefs and hunches. | facilitating conversations to help students recognize their misconceptions. |
discussing, reflecting and writing about their experiments, observations, predictions, and reasoning. | paying attention to students' observations, predictions, and reasoning; and encouraging self-reflection. |
using technology to generate random outcomes to explore and become comfortable with variation. | using the outcomes generated by technology to facilitate discussions around variation. |
Exploring Probability - Explore It (Object Interactive),an interactive resource that allows students to explore outcomes resulting from tossing a coin, rolling a die, and using a spinner.
Two Points - Who Won the Basketball Game?, a challenge where two coin tosses are used to simulate one shot, in order to achieve probability ¾ of making the shot.